We're excited to introduce powerful new visualization tools to your client portal, designed to give you unprecedented insight into your property's security and patrol activities. These features provide a clear, interactive overview of where security is focused, identifying areas of high activity, and ensuring comprehensive coverage.
1. The Interactive Security Map: Your Property, Visualized
At the heart of these new features is an enhanced interactive map that transforms raw data into actionable intelligence. Get ready to see your security operations in a whole new light!
7. Real-Time Performance Dashboard
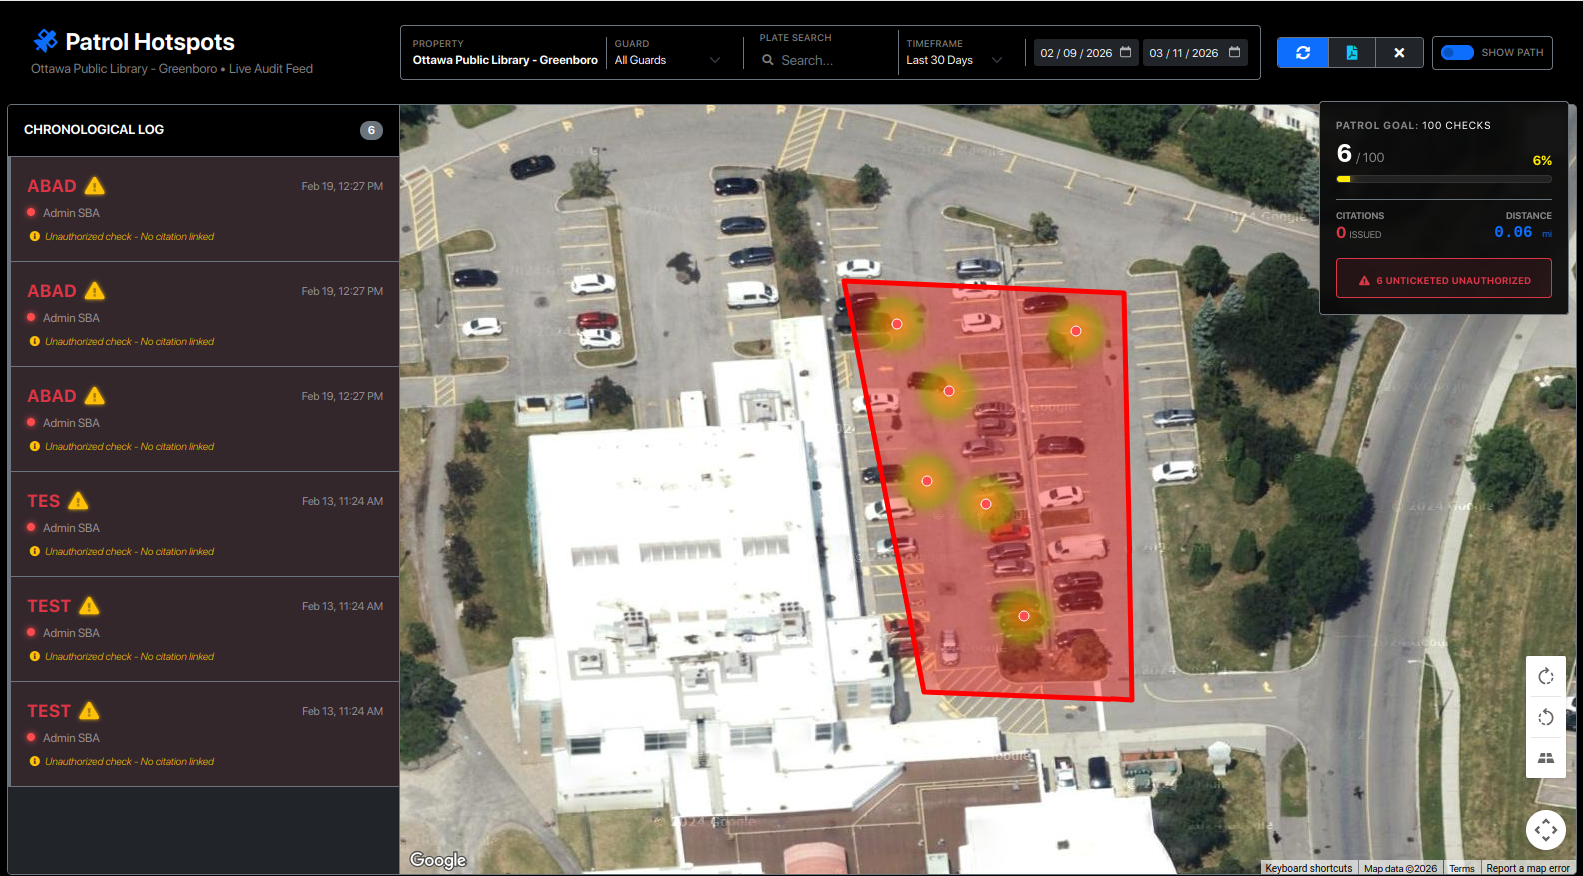
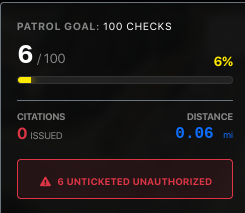
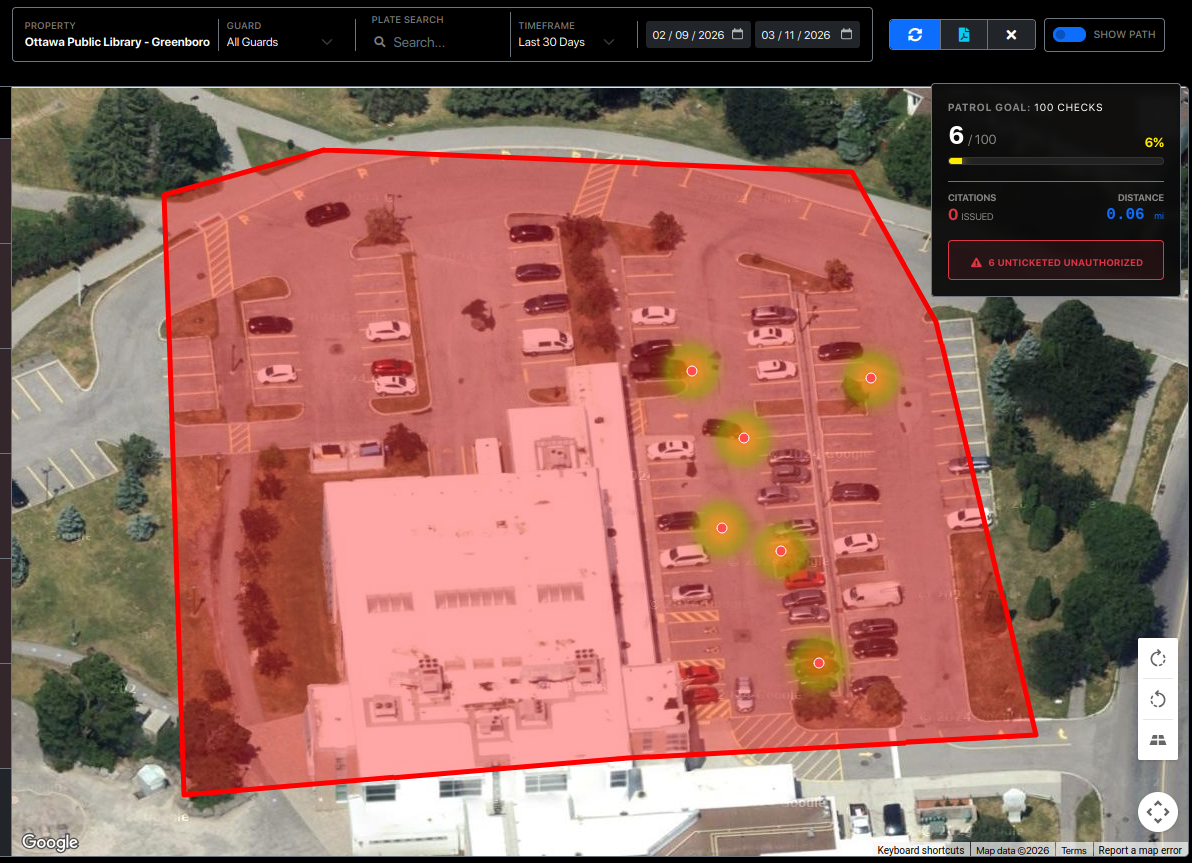
Located directly on your map, the Performance Card provides a live statistical breakdown of the current audit period. This allows you to measure security effectiveness against your specific site goals at a glance.
Key Metrics Explained:
Patrol Goal Tracking: The Visualization: Shows a progress bar (e.g., 89/90 checks) and a percentage completion (99%).
The Value: Instantly verify if the security team is meeting the contractually agreed-upon number of vehicle checks for the shift.
Citations & Distance:
Citations Issued: Displays a running total of all violations processed during the selected window.
Distance (Mileage): Displays the total accumulated travel distance of the patrol. This ensures guards are moving throughout the property and not remaining stationary.
Top Violations Breakdown: The Data: Lists the most frequent issues found on your property (e.g., "Private Area," "Expired Tags").
The Insight: Helps you identify specific recurring problems so you can adjust property rules or improve signage.
The "Unticketed Unauthorized" Alert: The Feature: A high-priority red alert showing vehicles identified as unauthorized but not yet issued a citation.
The Action: This is a "Safety Net" feature. It highlights missed enforcement opportunities or areas where guards may have been interrupted before completing a ticket.
2. Dynamic Geofence: Defining Your Protected Area
The Geofence feature visually establishes the exact boundaries of your property directly on the map. This transparent, red perimeter helps clarify the precise scope of patrol and provides immediate geographical context for all security activities.
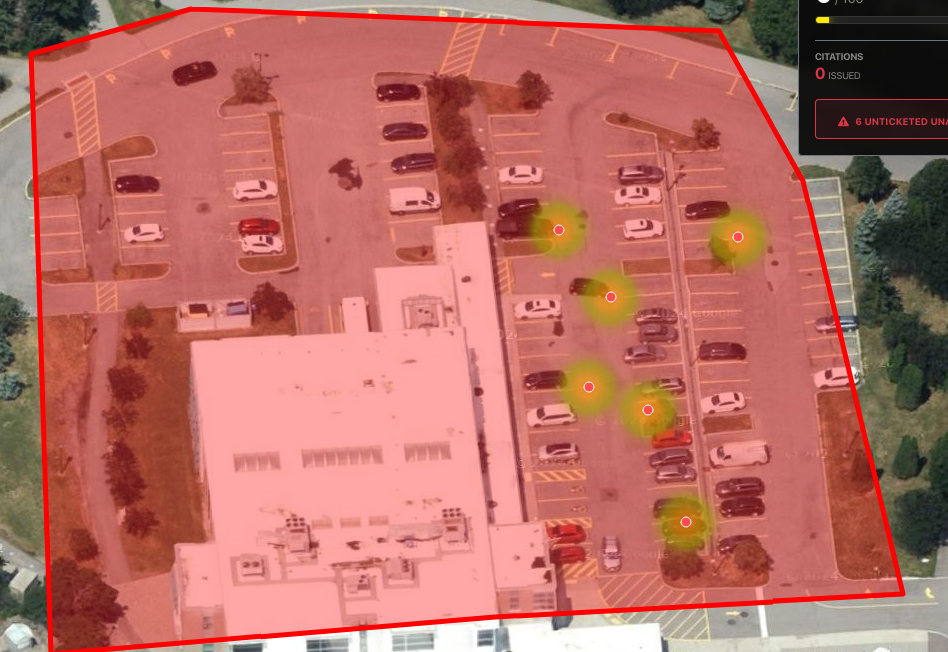
3. Patrol Hotspots: Unveiling Activity & Areas of Interest
The "Patrol Hotspots" feature, displayed as a heatmap, highlights areas of concentrated security activity or, more critically, areas where unauthorized vehicles or suspicious activities are most frequently detected. This visual density map helps you quickly identify patterns and potential vulnerabilities.
How to Use It:
Automatic Display: When you first load your site, the map defaults to showing the patrol hotspots (heatmap).
Toggle On/Off: You can turn the patrol hotspots on or off using the "Patrol Path" toggle button (usually found near the map controls). When the Patrol Path is active, the heatmap is typically hidden to provide a clearer view of the guard's route.
4. Patrol Path: Tracing Security Movement
Beyond static hotspots, the "Patrol Path" feature allows you to visualize the exact routes taken by security personnel within your property. This dynamic, neon-colored trail provides a transparent look at patrol coverage and efficiency.

What it Provides:
Route Verification: See the precise paths taken by guards over the selected time period.
Coverage Assessment: Verify that all critical areas of your property are being regularly visited and monitored.
Distance Traveled: A "Patrol Stats" card will appear on the map, showing the total distance (in miles or kilometers) covered by patrols during the selected period. This offers a clear metric of security team engagement.
How to Use It:
Activate the Path: Click the "Patrol Path" toggle button on the map interface. The map will switch from showing hotspots to displaying the guard's route.
Filter by Guard: Use the "Guard Filter" dropdown (typically in the sidebar) to view the path of a specific security officer, allowing for detailed performance review.
Date Range: Adjust the date range selectors (e.g., "Last 7 Days") to see patrol routes for different timeframes.
5. Interactive Activity Feed: Detail at Your Fingertips
The sidebar activity feed works hand-in-hand with the map, providing a detailed, chronological list of every security check performed. It's your central hub for granular activity data.
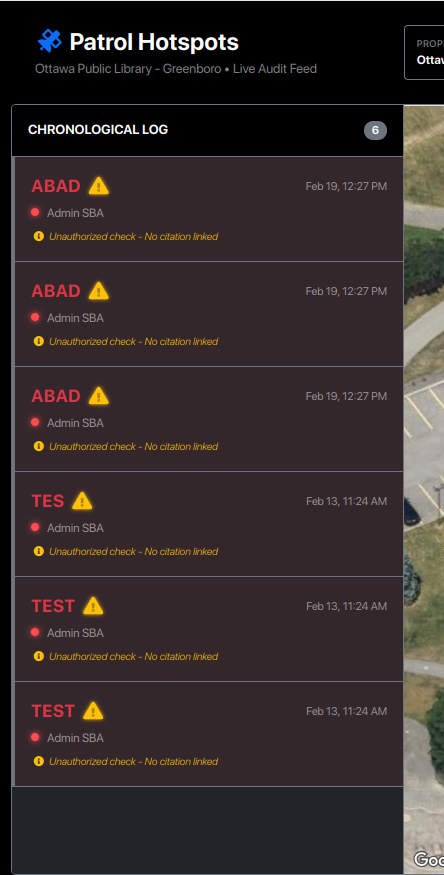
What it Provides:
Detailed Records: Each entry shows the plate number, time, and the guard who performed the check.
Direct Map Linking: Clicking any entry in the sidebar instantly zooms and pans the map to that exact location.
Smart Violation Alerts: The system identifies unauthorized vehicles and automatically highlights them for immediate attention.
Intelligent Citation Linkage: > How it works: Our system uses a 30-minute "Smart Window" to correlate data. If a guard scans a vehicle and a citation is issued within 30 minutes of that scan, the system automatically links them. This ensures that the evidence photos and ticket details are perfectly synced with the patrol check, even if the paperwork was completed moments after the initial scan.
Filtering: Use the search bar to find specific license plates or use the dropdowns to filter by guard or violation type.
6. Professional PDF Reports: Audit-Ready in One Click
Need to present your findings in a board meeting or save a hard copy for your records? Our new PDF Export tool compiles all map data, activity logs, and photographic evidence into a professionally formatted report. This turns complex patrol data into a clear, authoritative document for stakeholders.
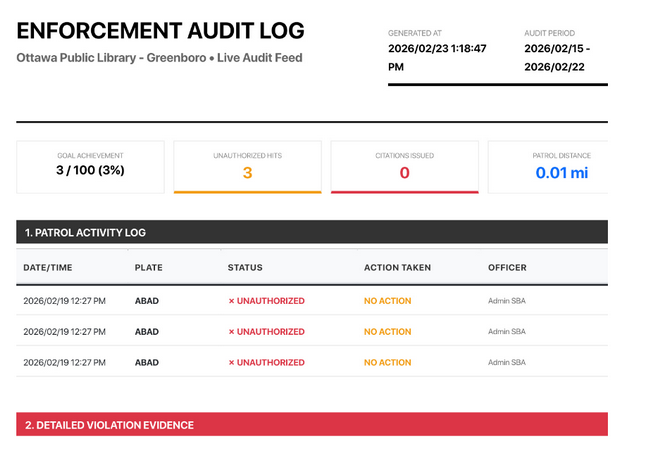
What the Report Provides:
KPI Summary: At-a-glance metrics including total patrol checks, unauthorized vehicle counts, and total miles patrolled.
Patrol Log: A clean, chronological table of every vehicle scanned, including its authorization status and the officer in charge.
Violation Evidence Gallery: High-resolution photos of citations, including license plate close-ups and vehicle positioning, are embedded directly into the report.
Custom Branding: Reports automatically include your site’s specific name, the selected date range, and a "Generated At" timestamp for compliance and auditing.